
To efficiently navigate the world around us, our brains have developed shortcuts to pre-select the most relevant visual information at first glance. In the era of rapid web browsing and content leveraging, however, the goalposts have moved. Visual and auditory stimuli constantly enter screens from every corner of the internet, making audience engagement on a single webpage a potentially difficult task.
Enter 3M’s Visual Attention Software (VAS), a web-based tool that analyzes digital designs and photos, and predicts what is likely to grab consumer attention within the first three to five seconds of viewing. Users simply upload any image they want analyzed — a company logo, a webpage graphic with vital brand information, etc. The software then analyzes the effectiveness of each image, and generates results identifying the five visual elements proven to attract human attention: edges, intensity, faces and strong differences in red/green contrast and blue/yellow contrast, according to 3M.
In doing this, VAS helps users iterate during initial web design stages to ensure viewers are engaging with the intended areas of a given webpage.
Customized Insights Reports
VAS software simulates an early phase of human vision called pre-attentive processing — a phenomenon that occurs when we first glance at something, but before we’re aware of what we’re looking at. This “first glance” is critical in capturing audience interest and creating designs with impact. If viewers see your content within the first glance timeframe, it’s more likely they will engage with it consciously later, according to 3M.
Using the program, users are able to mark these priority areas within a design, and receive focused reports and feedback on selected sections including:
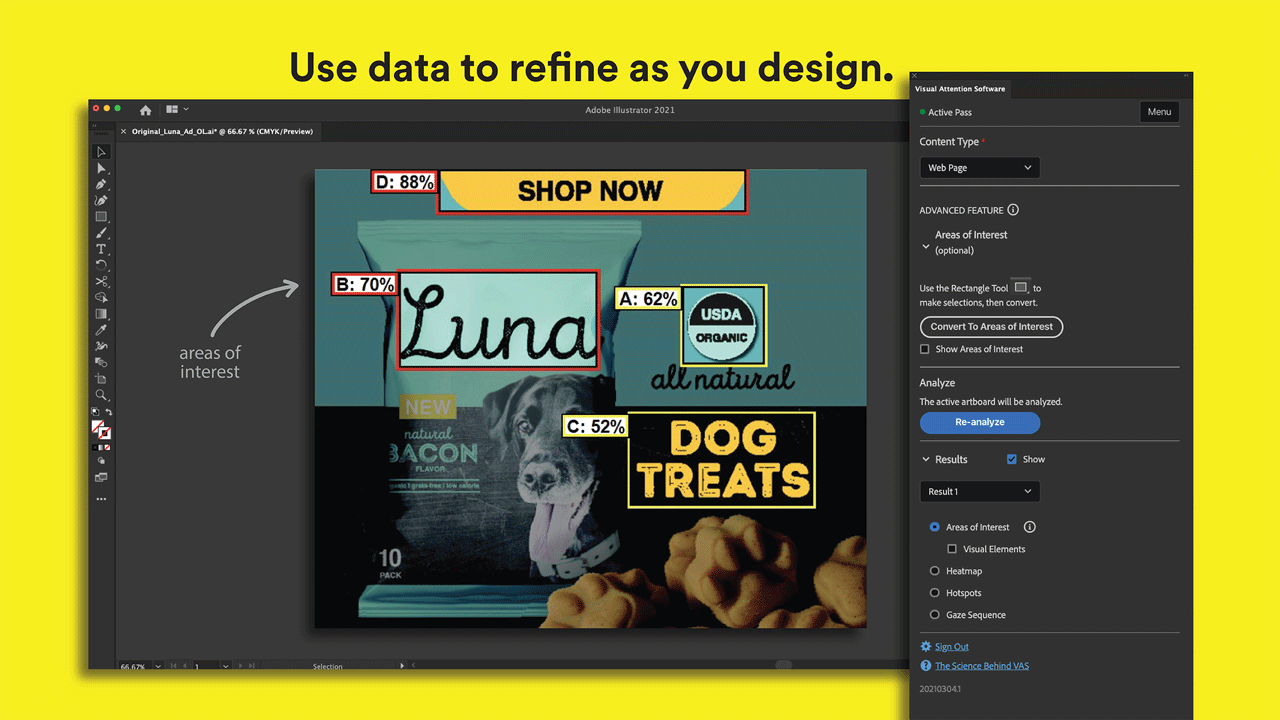
Areas of interest - VAS provides probability scores on the likelihood that specified areas of interest will be seen with the design.
Visual elements - Scores the elements to determine attention — edges, color contrasts, intensity and faces. Data can guide refinements that may strengthen viewer’s attraction.
(How can designers and retailers use this technology to assess client preferences? See story on page 28).
Automated Insights Reports
Following analysis, users are able to see what their audience sees on a given image or logo. If a visual element needs reworking, they can make adjustments and upload to VAS for further analysis until they have met their visual hierarchy goals.
VAS also provides an
overall analysis of a user’s visual content through:
Heatmap - Provides a visual overview of the salient areas of the design.
Hotspots - Scores the probability of gaining viewer’s attention in the hotspot regions of the heatmap.
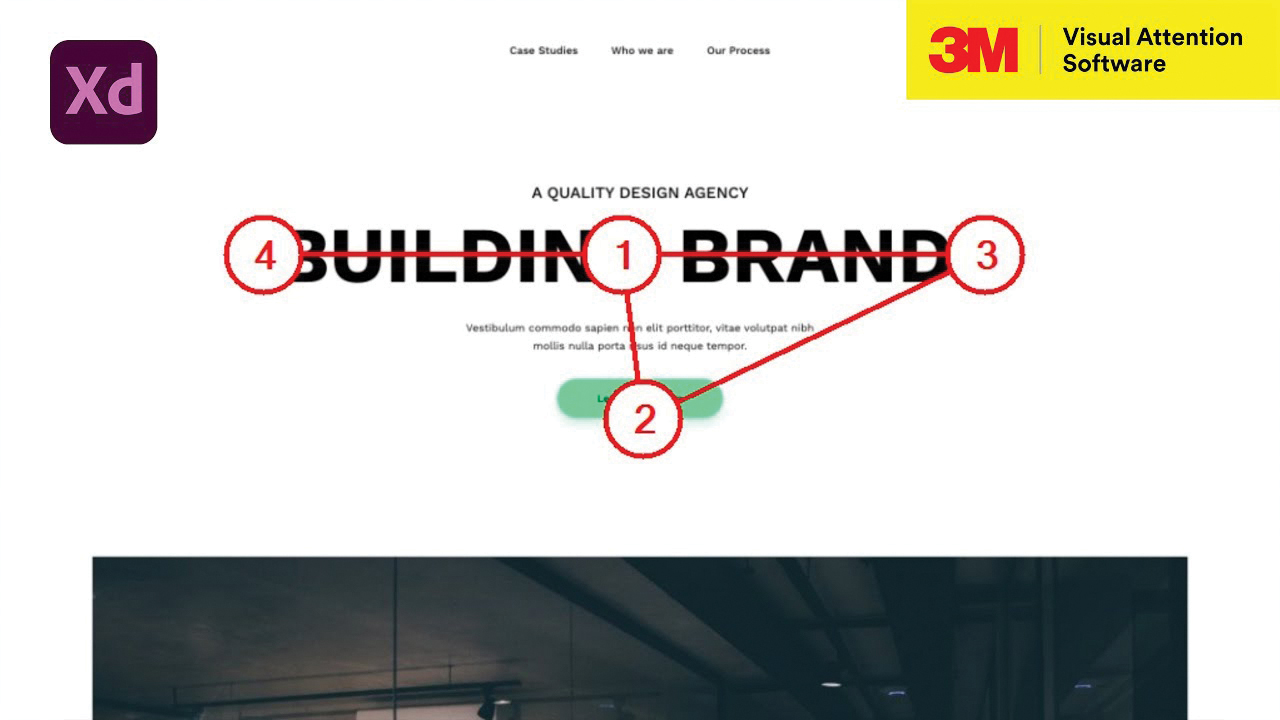
Gaze sequence - Presents the order a person will view the first four areas most likely to be noticed.
VAS costs $49 per month per user, or $588 per year per user, for unlimited user access.


