As the 2020 pandemic sent the real estate market into a tailspin, homeowners began reevaluating their priorities, noting what is really important to them in the home experience. Angi.com surveyed 1,499 Americans over the age of 25 about the living spaces and home features that matter most to them.
With more people cooking at home during the pandemic, it’s no surprise that 34 percent of respondents value a large kitchen the most. Outdoor spaces ranked second, with 27 percent of respondents listing them as their most valued feature. Home offices and guest bedrooms were last on the list, with 7 percent and 4 percent of responses, respectively.
The survey also analyzed responses by gender, with women valuing large kitchens (44 percent of women vs 27 percent of men) and extra storage space (15 percent of women vs 11 percent of men) more than men. Men, on the other hand, value entertainment rooms (20 percent of men vs 9 percent of women) and home offices (9 percent of men vs 6 percent of women) more than women.
When looking at the results by age, 4 percent of respondents ages 45 to 54 said a guest room was their most valuable living space, which was the highest of any age group — even higher than those over 65, who are likely to have children and grandchildren. Angi didn’t ask why, but speculates that guests have not been a priority during the COVID-19 pandemic, as people have been encouraged to limit expo- sure to people outside their personal pods.
When it comes to features, 30 percent of respondents say updated appliances are the most valued. Hardwood floors came in second at 28 percent, and home gyms were the least valued, at 10 percent. Only 20 percent value smart home technology, with 58 percent of those ages 25 to 54 listing it as their most valued.
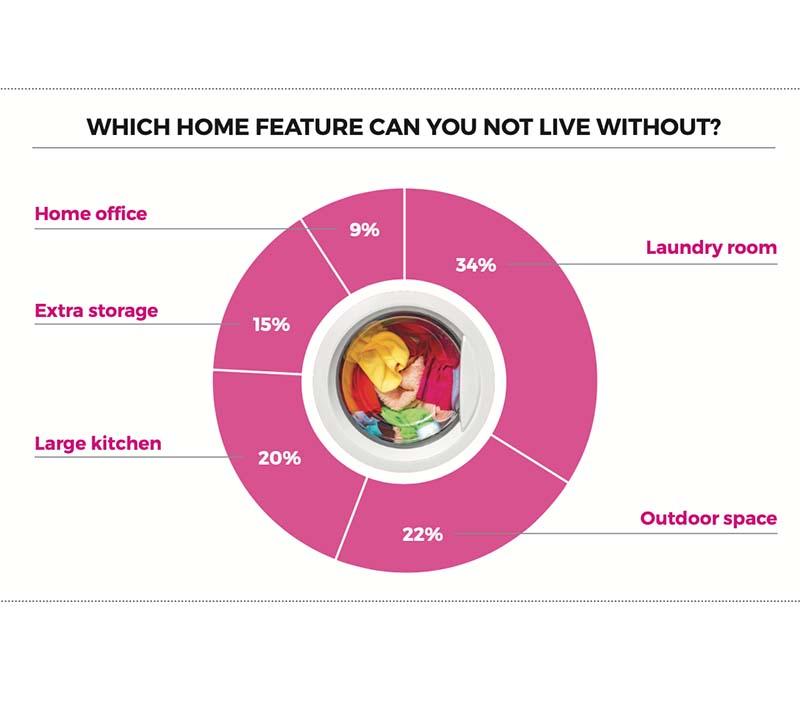
Thirty-four percent of respondents say a laundry room is a feature they cannot live without, while 22 percent cannot live without outdoor space. Perhaps surprisingly, only 9 percent say they cannot live without a home office. See the graphs for the full breakdown of the results. To see more charts, visit the article in the November issue.
What Matters Most to Consumers in Their Homes?


