over white cabinets (17 percent). (Photo: Ashton Woods)")
As much as we’d like to be the drivers of our own destiny, external factors affect the health of our industry, housing included. Right now, a construction labor shortage, higher home prices and mortgage interest rates, plus wage increases made essentially null by rising inflation, are contributing to a slowdown across the country. What exactly do the stats say? Together, Existing Home Sales and Housing Starts reports provide a great picture of the health of the housing market at present and in the immediate future.
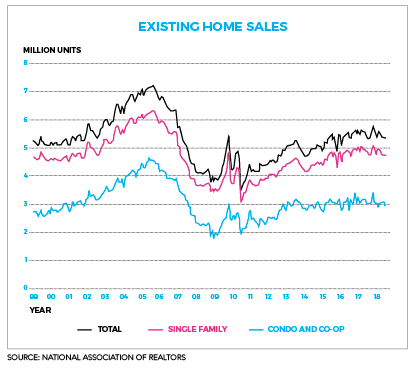
Existing Home Sales
Why should you care?
This statistic, released monthly by the National Association of Realtors (NAR), measures the number of sales of existing single-family homes, townhomes, condos and co-ops that closed. It’s important because it indicates consumer demand.
The latest at press time:
After four months of decline, existing home sales remained steady in August at an adjusted rate of 5.34 million. Sales remain down 1.5 percent from a year ago.
August inventory was unchanged and the first-time buyer share of 31 percent was down 1 percent from last month and unchanged from a year ago. Homes stayed on the market for 29 days in August, down from 30 days a year ago.
The median sales price of $264,800 was up 4.6 percent from a year ago — this marks 78 consecutive months of increases. The median condominium/co-op price of $244,500 was up 2 percent from a year ago.
Regionally: Existing sales increased in the Northeast and Midwest — 7.6 percent and 2.4 percent respectively — but fell just slightly in the South (-0.4 percent) and greater in the West (-5.9 percent). Compared to last year, sales increased 1.8 percent in the South, but fell 0.8 percent in the Midwest, 2.7 percent in the Northeast and 7.4 percent in the West.
“While inventory continues to show modest year over year gains, it is still far from a healthy level and new home construction is not keeping up to satisfy demand,” said NAR Chief Economist Lawrence Yun at a press conference. “Homes continue to fly off the shelves with a majority of properties selling within a month, indicating that more inventory — especially moderately priced, entry-level homes — would propel sales.”
Housing Starts
Why should you care?
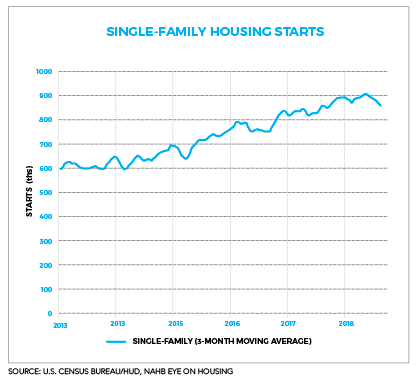
The “New Residential Construction Report,” released monthly by the U.S. Census Bureau jointly with the U.S. Department of Housing and Urban Development (HUD), tallies the number of foundations started. This statistic is important because an increased demand for new homes can also translate into an increased demand for products that homebuyers will need, like furnishings.
The latest at press time:
Last-released numbers had outperformed expectations. Total housing starts increased 9.2 percent in August to 1,282,000 units, clocking in at 9.4 percent above the August 2017 rate. Mutlifamily made up the majority of this increase, with single-family rising only 1.9 percent since July.
Hurricanes Florence and Michael are expected to have a downward effect on the starts data from September and October respectively, and concerns about housing affordability, tariffs and labor shortages continue to be a factor moving forward.
Homebuyer Preferences
Ashton Woods, one of the country’s largest private homebuilders, released its 2018 National Homebuyer Survey in September. The company surveyed 1,405 people ages 27 to 70 who are looking to move from their current home within the next 10 years. Participants were surveyed across the United States regarding their preferences for home design and what they want to see in their next home. At least 100 participants were surveyed in each of the following cities: Atlanta; Austin, TX; Charleston, SC; Dallas; Houston; Orlando, FL; Phoenix; Raleigh, NC; San Antonio, TX; and Tampa, FL. An additional 318 participants were surveyed outside of these areas.
The Findings
Style Preferencs
Overall, participants showed a preference for the Ranch Architectural style (13 percent) and the Modern style (13 percent), as well as Cottage (9 percent), Traditional (9 percent), Farmhouse (8 percent), Craftsman (8 percent) and Mediterranean (7 percent) styles. Victorian came in at 7 percent, followed by Contemporary (5 percent), Colonial (5 percent), Transitional (4 percent), Mid-Century Modern (4 percent), Tudor Revival (3 percent), Spanish (2 percent) and Greek revival (2 percent).
Baby Boomers showed a clear preference for the Ranch Architectural style (20 percent). Generation Xers were split between the Ranch (13 percent) and Modern (13 percent) styles. Millennials showed a preference for Modern (13 percent).
When it comes to interior design styles, participants were split equally (14 percent) among Transitional, Traditional, Contemporary and Farmhouse. Those styles were followed closely by Rustic (12 percent). The other styles that were less preferred included French Country (6 percent), Industrial, Mid-Century Modern and Coastal (all at 5 percent), Shabby Chic and Bohemian (both at 4 percent), and Scandinavian (3 percent).
Interior Design Elements
Participants said custom built-ins (27 percent) were their favorite design element they would consider implementing in their next home, followed by decorative ceilings (21 percent).
Other design elements participants said they would like to incorporate included colored backsplash, arched doorways, wallpaper, window boxes, antique light fixtures, wood patterned tile, window treatments and fully tiled bathrooms.
Overall, participants said Brushed Nickel (21 percent) and Stainless Steel (16 percent) were their favorite metal finishes. Satin Brass (2 percent), Satin Bronze (3 percent) and Gold (4 percent) were the least favorite material finishes. Ashton Woods has seen a recent uptick in requests for these finishes, which shows that the general consumer lags a bit behind the trend here. While Baby Boomers and Generation Xers both said Brushed Nickel was their preferred material finish, Millennials disagreed with their elder generations, selecting Stainless Steel and Oil-Rubbed Bronze as their preferred material finishes.
By far, participants preferred hardwood flooring (38 percent) over parquet, luxury vinyl, laminate, carpet, tile and other flooring materials. Interestingly, carpet was selected as the second favorite option, but also made a strong appearance among the least favorite options — showing the polarizing nature of the flooring material.
And, of note: Places for Pets
The majority of participants (77 percent) were pet owners, having either a cat or a dog living in the home. Nearly half of participants who have a pet (48 percent) said having a dedicated space for them in their next home is important. This group makes up 37 percent of overall participants. Millennials were most likely say it was important for their next home to include a dedicated space for their pets.